Humidity

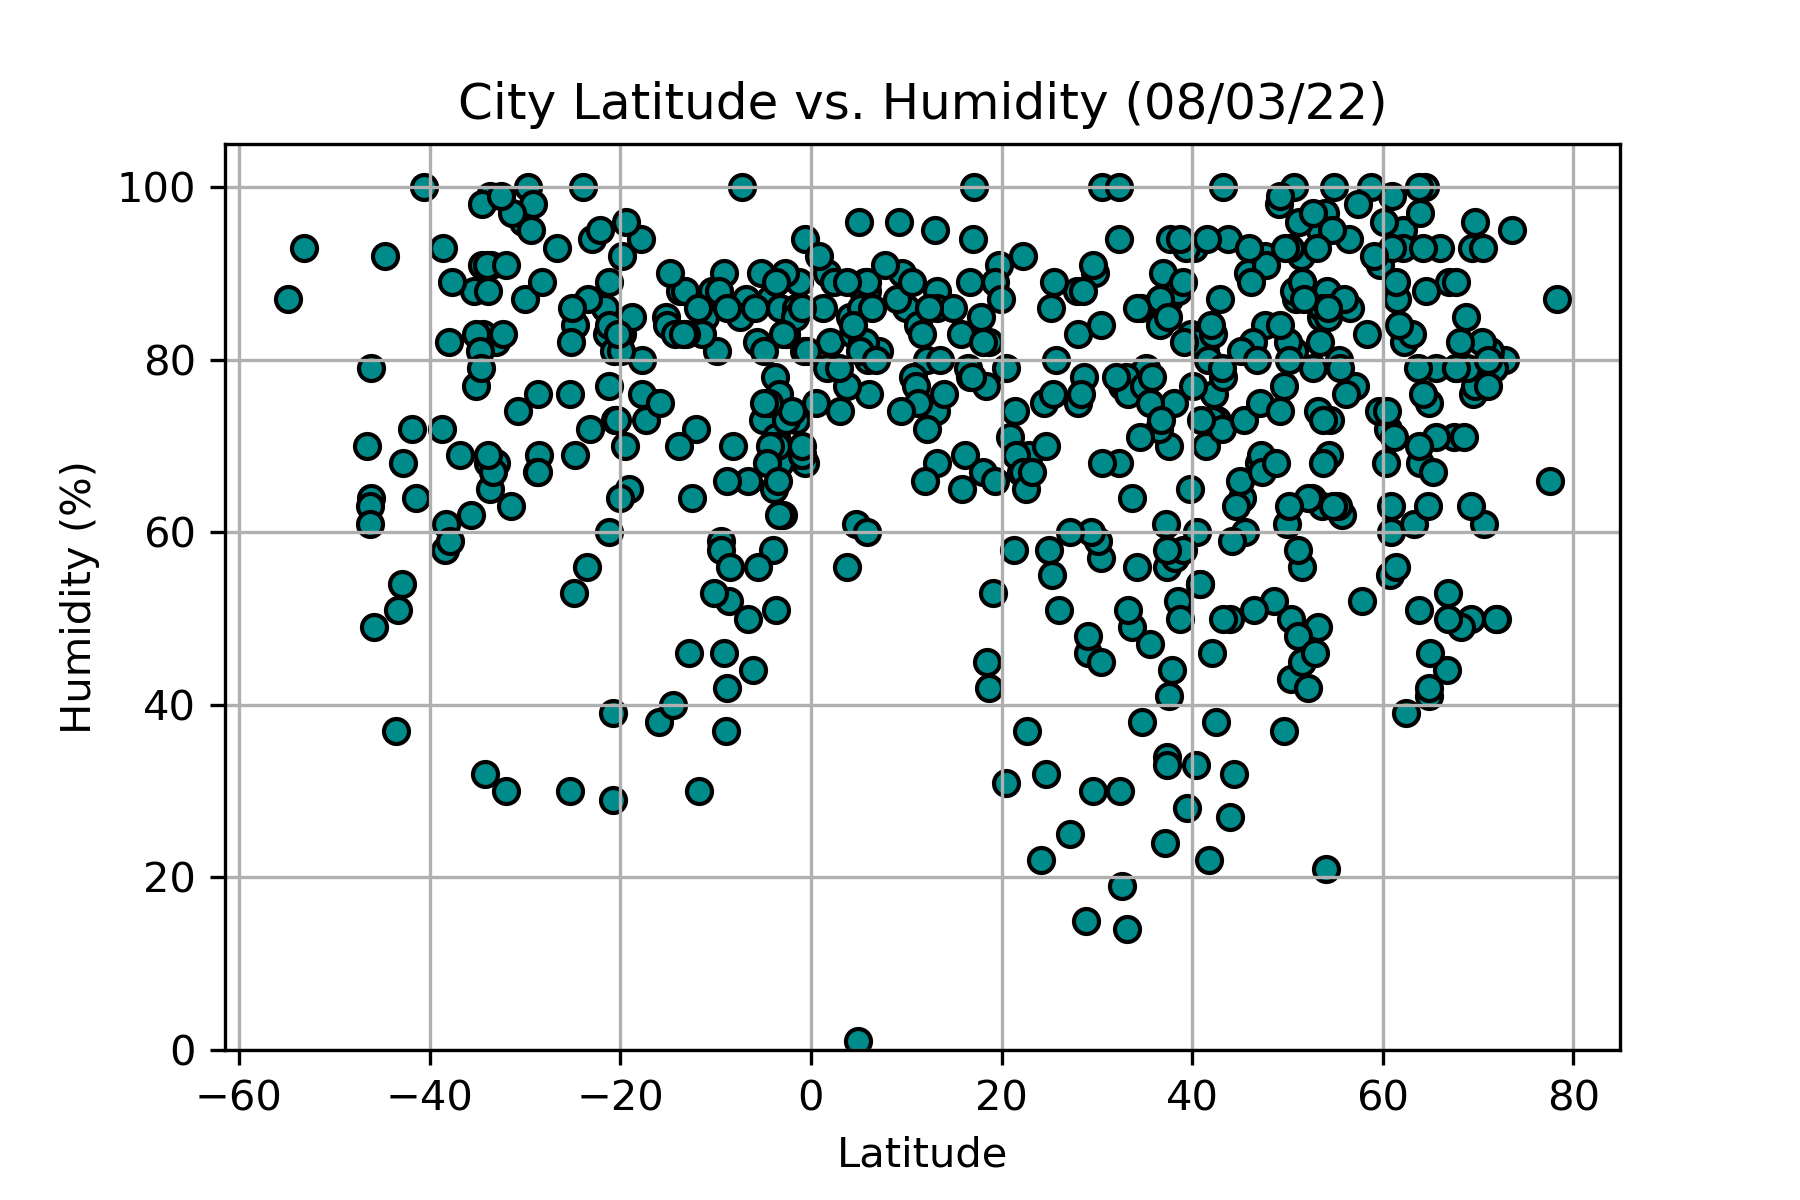
The above scatter plot displays the humidity percentage recorded on the date of the API query and the corresponding latitude of the city. Even though there is no correlation between the city's location and its humidity, the cities with latitudes between 0 and 20 have a smaller range in the humidity with most recording humidity between 60% and 100%.


